Comparison Radial: Start comparing team stats
Frederik Hvillum
With Veo’s new feature, Comparison Radial, you can now compare metrics between the teams within your club or assess your own team in different periods.
In the ever-evolving world of sports, data-driven decision-making has become a game-changer for coaches and teams. The ability to harness the power of data and transform it into actionable insights not only improved how coaches teach the game but also changed how we understand football analysis.
To make data-driven analysis easier for the coaches, Veo has introduced a new feature called Comparison Radial. This feature is available to users in Analytics Studio. You will find the Analytics Studio inside your team's page on the Veo platform.
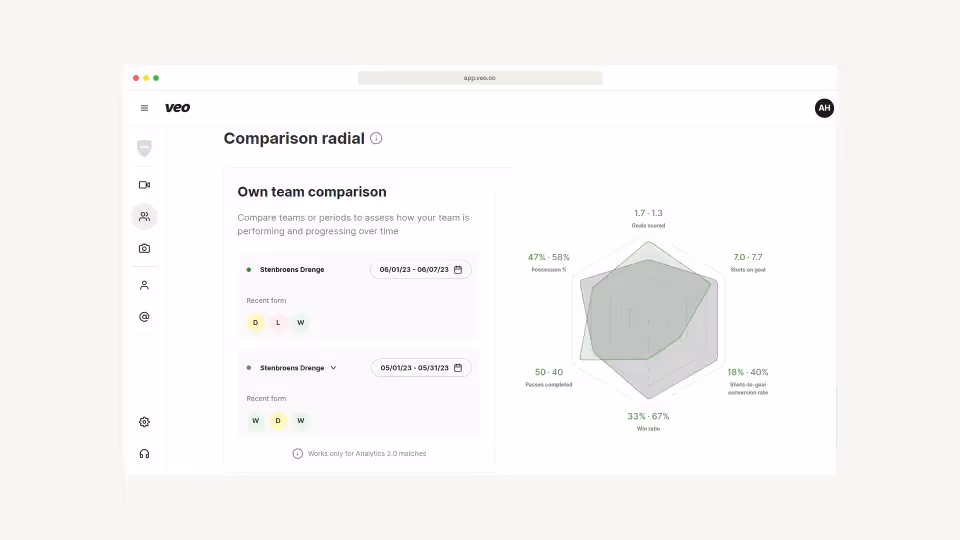
The Comparison Radial is a tool that allows coaches to swiftly compare key metrics between teams within their club or assess their own team's performance over different time periods. Shaped like a diamond, this feature provides a comprehensive view of six essential metrics: goals scored, shots on goal, shot-to-goal ratio, conversion rate, win ratio, passes completed, and possession percentage.
But how does this tool really impact the way coaches analyse and compare data?

We sat down with Japhet Bitsindou, coach at the U14 Boys team of B.93 – one of Northern Europe's most acclaimed academies and Sam Rafique, UEFA A License coach with experience from Poland, Australia, and England, to explore why comparing teams within a club is not just important but often the key to unlocking a club's full potential.
How does the Comparison Radial help you analyse and compare data across different teams and dates?Japhet: At my club (B.93), the philosophy is to keep possession of the ball. The Comparison Radial helps me track how my team is developing over the season or how well we’re doing compared to other teams at the club.
Sam: A feature like this helps by giving me that data in an instant. Typically, if I wanted this, I would have to manually get it from each game or each metric and then put it in my own spreadsheet or graph. But then the information would be in different places. Here, it is all in one place.
Could you provide an example of how you might use the Comparison Radial to identify trends or changes in team performance over a specific time period?Japhet: I could use the shots-to-goal conversion to compare games weeks where we put a lot of focus on finishing drills during training to the weeks we don’t focus that much on a specific drill like this.
Sam: The shots-on-goal metric is useful to quickly identify if we are creating the same number of chances. If we suddenly have a game where we create half the chances of the previous three, it is easy to see that and then identify the cause by going back to the recording. You could use this example for any other metric. I just prioritise the creation and conceding of chances.
How does the Comparison Radial assist you in making tactical or strategic decisions based on the insights gained from comparing data across teams within the club?
Sam: It helps me confirm trends I think I am already seeing. I would not make a decision solely based on the radial or on stat trends, but it will help me to confirm what I might think.
Japhet: The Comparison Radial plays an important role in shaping our tactical decisions. When you have concrete data at your fingertips, it offers a new dimension to your decision-making process. Moreover, the Comparison Radial helps me identify patterns we might not have initially noticed.
How has the Comparison Radial tool influenced your ability to maintain a consistent playing style?
Sam: The radial helps keep my playing style as consistent as possible. There are always ups and downs, but if I can link certain metrics to when we are struggling, then it helps me identify issues. If there are big variations, I can see them easily and address them.
Japhet: The introduction of this tool has influenced our ability to maintain a consistent playing style. No matter the level you are playing at, it’s always great to see the development of your team over time, and it’s even better when it’s backed up by data.
You can learn more about Japhet’s coaching philosophy in the “Post-match Analysis with B.93 U14 Boys” Veo Academy course. In five lessons, you’ll get an introduction to the Veo Analytics features and in-depth guidance on how to make the most of them. Watch the course here.